Example data

Explore a month of Signals

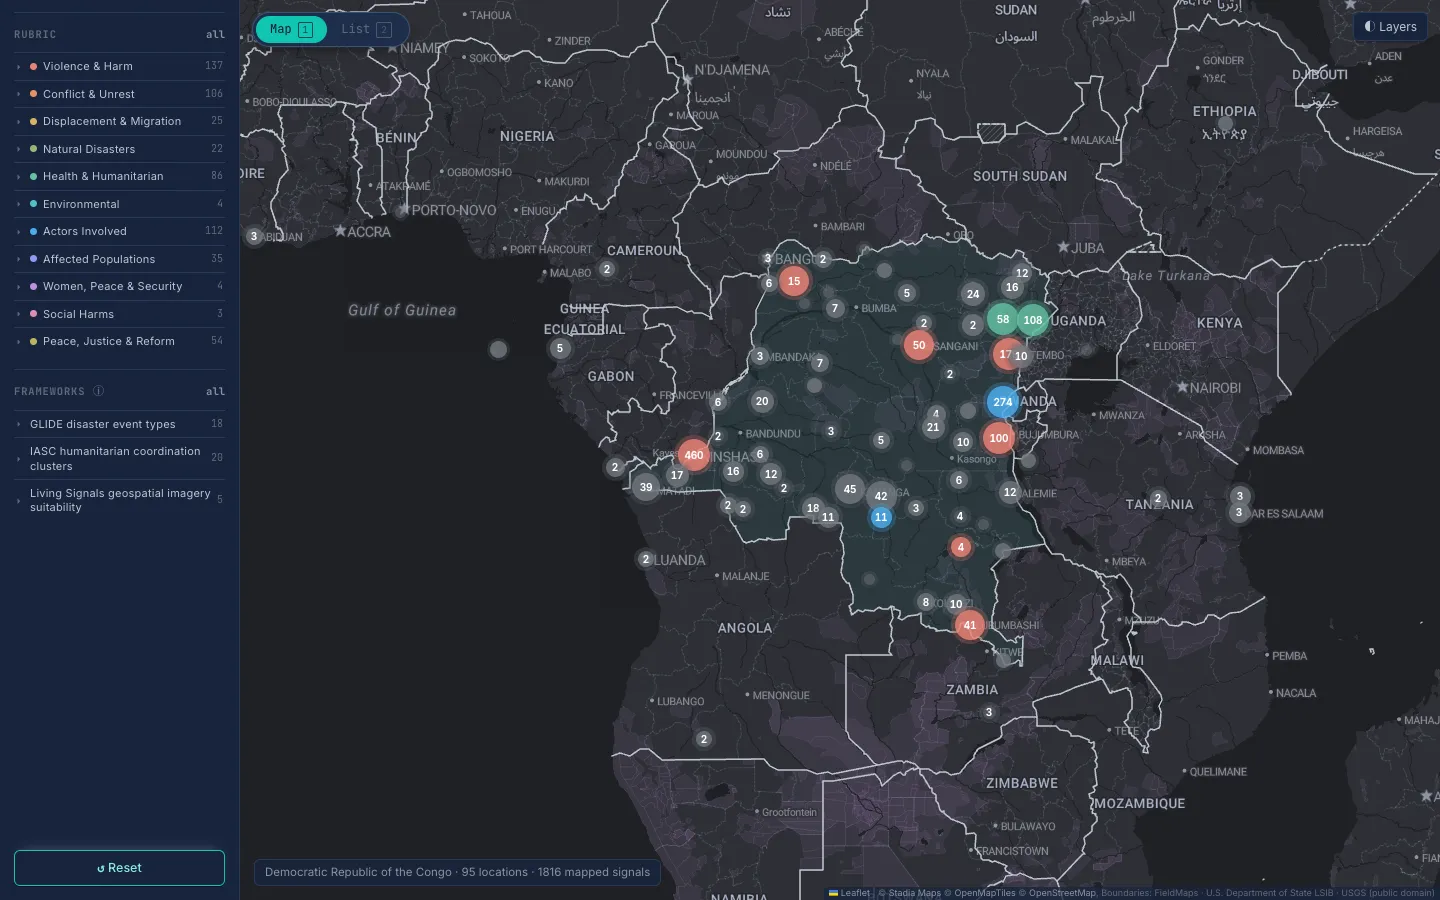
The Living Signals dashboard, running on a month of real data. Pick a country: DR Congo opens on the map, Cameroon and Mali on a Signal with its satellite views.

The Living Signals dashboard: 3,253 Signals in one month

Example data: 3,253 Signals from our production pipeline for 15 Aug – 15 Sep 2026, with a hand-checked set open in full. Runs with no live connection. Satellite views carry their own attribution.

Read instead

The stories in brief

DR Congo

15 Aug – 15 Sep 2026

Open this story in the dashboard
  1. One month in DR Congo

    3,253 Signals from 303 sources

    Each Signal gathers local and international reporting about one event, extracted, merged and graded into eleven categories.

  2. Multilingual coverage · satellite timing

    One school fire, reported in 8 languages

    On 10 September a fire swept through two primary schools in Cimpunda, Bukavu. 21 outlets reported it in Arabic, Bengali, English, French, Nepali, Odia, Swahili and Turkish, and this Signal gathers 22 of their claims. A Sentinel-2 satellite passed over about 90 minutes after the fire started.

  3. Filter: Health & Humanitarian

    An outbreak, and the attacks around it

    Filter to Health & Humanitarian and the Ebola outbreak across Ituri and North Kivu appears: treatment centres opening in Beni and Butembo, cases in Bunia schools. When response teams come under attack, as an ambulance in Bunia and a convoy in Kandoy did, the same Signals also carry Conflict & Unrest or Violence & Harm.

  4. Geospatial enrichment · pilot

    A wildfire, checked from orbit

    A single local radio report said about 20 hectares of vegetation burned on Nyabibwe hill from 31 August. Sentinel-2 imagery shows a 14-hectare scar that grew while the fire was still burning: the right place, the right days and a plausible size. A Signal from one source now has independent evidence behind it.

  5. Beyond violence

    Peace work and women’s inclusion are Signals too

    Ituri launched a peace plan built around women’s inclusion. In Kinshasa, the authorities and the opposition agreed a compromise over a protest route, and the president set up a national dialogue committee. A girls’ reporting club delivered hygiene kits to displaced women in Ramba. Slow-onset risks and positive-peace developments sit on the same map as violent events, and every Signal here is also available through the API and the MCP connector for AI assistants.

Cameroon

4 Aug – 3 Sep 2026

Open this story in the dashboard
  1. One month in Cameroon

    606 Signals from 75 sources

    Floods and a landslide in Limbe. Armed raids around Tourou in the Far North. A separatist-enforced lockdown in Buea. Food aid for refugees and displaced families, and a regional summit on the Congo Basin forest. One month of Cameroon, each Signal pinned to where it happened.

  2. Geospatial enrichment · pilot

    A gold rush, measured from orbit

    On 18 August a pit collapsed at an artisanal gold-mining site near the border with the Central African Republic, and 10 sources reported it. The satellite record shows what the reporting could not: in January 2025 the site was a clearing of about 0.2 hectares. A year later, cleared and mined ground covered about 154 hectares.

Mali

20 Aug – 19 Sep 2026

Open this story in the dashboard
  1. One month in Mali

    842 Signals from 130 sources

    A convoy of fuel tankers reaching Bamako under military escort. Millet prices climbing in Koro. Flooding in Sikasso. A national week of reconciliation in Bandiagara and Gao, and the attack on the Dioura military camp. One month of Mali, each Signal pinned to where it happened.

  2. Transboundary hazard · NASA imagery

    A dust storm no single report could map

    On 5 September a wall of Saharan dust swept across Mali towards the Atlantic. Two reports described it. NASA’s daily satellite views show how far it reached, and the UV aerosol index traces the densest dust along an arc in the north-east of the country.

Pilot

Enriched Signals with geospatial data

For a hand-picked set of Signals we match open satellite data to the place and dates the reporting gives, then read it for what the reports describe: a burn scar, newly cleared ground, a plume of dust. The satellite views in the stories above are examples of that work.

These are proofs of concept that show what is possible, not yet a feature on every Signal. Imagery corroborates what sources describe; it does not replace them. Where reporting names a place only vaguely, a scene can miss the exact site, so each view is checked by hand before it is attached.

  • Fire and burn scars

    Sentinel-2 scenes before and after a reported fire, a burn map from the change in near- and shortwave infrared, and NASA FIRMS thermal detections for timing.

    Example: Nyabibwe hill and Bukavu, DR Congo

  • Cleared and mined ground

    Scenes a year apart and a change map of newly cleared or built ground, measured in hectares, for sites the news reports only when something goes wrong.

    Example: Zamboye gold-mining site, Cameroon

  • Regional hazards

    NASA’s daily true-colour views and UV aerosol index for events larger than any one place, such as dust storms, smoke and floods.

    Example: Saharan dust storm, Mali